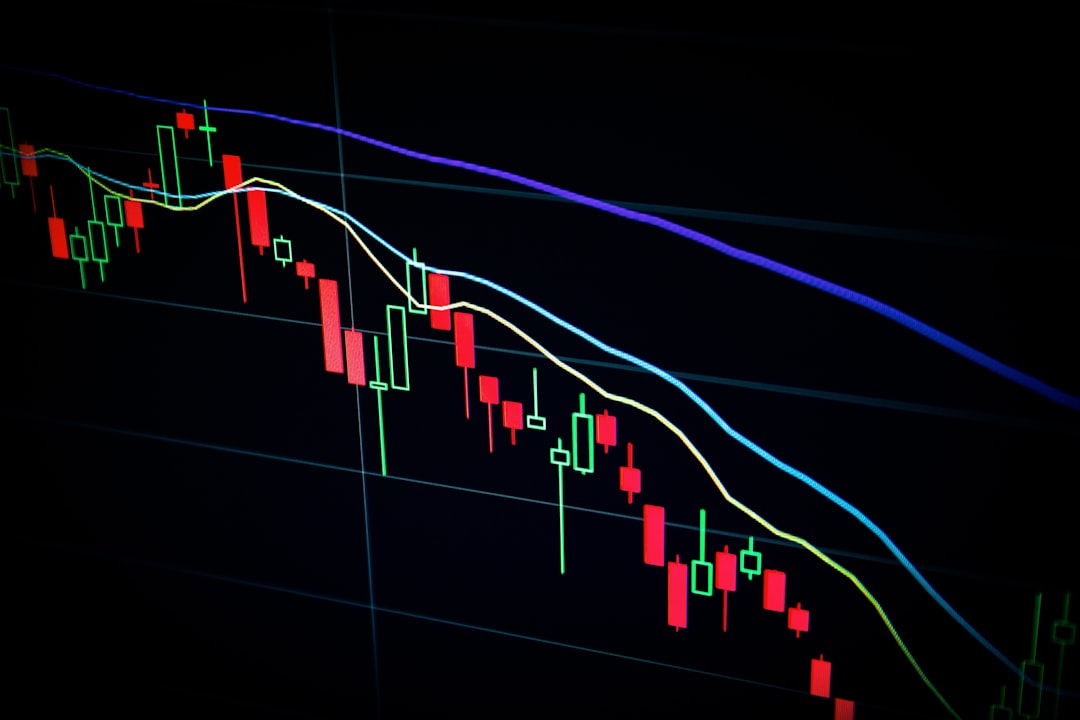
How to Build a Simple Forex Strategy That Actually Works
Most beginner traders make the same critical mistake: they jump between complex strategies, indicators, and systems looking for the "holy grail." The truth is, successful Forex trading doesn't require dozens of indicators or proprietary algorithms. In this guide, you'll learn how to build a straightforward, rules-based trading strategy that focuses on consistency rather than complexity. We'll cover the essential components every working strategy needs and how to test it properly before risking real capital.
Define Your Trading Timeframe and Market Conditions
Before adding any indicators or rules, you must decide when and where you'll trade. Your timeframe determines how often you'll monitor charts and how long you'll hold positions. Day traders might use 15-minute or 1-hour charts, while swing traders prefer daily charts. Choose a timeframe that fits your schedule and personality.
Next, identify the market conditions where your strategy will perform best. Most strategies work well in either trending markets or ranging markets, but rarely both. Trending strategies use momentum indicators and breakout patterns, while range-bound strategies rely on support/resistance and oscillators. Pick one environment to master first.
- Scalping: 1-5 minute charts, 5-20 pip targets
- Day trading: 15-minute to 4-hour charts, 20-80 pip targets
- Swing trading: 4-hour to daily charts, 80-300 pip targets
- Position trading: Daily to weekly charts, 300+ pip targets
Select 2-3 Core Indicators (Maximum)
Indicator overload is a common trap. Professional traders typically use 2-3 complementary indicators that serve different purposes. A solid combination includes one trend indicator, one momentum indicator, and clear support/resistance levels.
For trend direction, moving averages (20 EMA and 50 EMA) provide clean signals without lag. For momentum confirmation, the RSI (Relative Strength Index) or MACD works well. Support and resistance levels from daily or weekly charts add context. The key is that each indicator must answer a specific question: "Is the trend up or down?" "Is momentum strong?" "Are we near a key level?"
| Indicator Type | Purpose | Example Tools |
|---|---|---|
| Trend | Identify market direction | Moving Averages, ADX |
| Momentum | Confirm strength of move | RSI, MACD, Stochastic |
| Support/Resistance | Find entry and exit zones | Horizontal levels, Fibonacci |
| Volume | Validate price movements | Volume bars, OBV |
Create Clear Entry and Exit Rules
Vague criteria like "buy when it looks good" guarantee inconsistent results. Your strategy needs objective entry conditions that remove emotion from decision-making. Write down exact criteria that must align before entering a trade.
For example: "Enter long when price closes above the 50 EMA, RSI is above 50 but below 70, and price breaks above the previous swing high." Similarly, define your exits: take profit at a specific risk-reward ratio (minimum 1:2), and place stop-loss below recent swing low or above swing high for shorts.
Exit rules are equally important. Decide in advance: Will you use a fixed pip target, trailing stop, or exit when indicators reverse? Will you move stop-loss to breakeven after hitting 1:1? Write these rules down and follow them every single time.
Implement Strict Risk Management Parameters
Even the best entry signals fail without proper position sizing and risk controls. Never risk more than 1-2% of your account on a single trade. This means if you have a $5,000 account, your maximum loss per trade should be $50-$100.
Calculate position size based on your stop-loss distance. If your stop is 50 pips away and you're risking $100, your position size should be adjusted so that 50 pips equals $100 loss. Most platforms have calculators, or use the formula: Position Size = (Account Risk $ / Stop Loss in Pips) / Pip Value.
- Maximum risk per trade: 1-2% of account balance
- Maximum daily loss limit: 3-5% of account balance
- Minimum risk-reward ratio: 1:2 (make twice what you risk)
- Maximum open positions: 2-3 trades simultaneously
Backtest and Forward Test Before Going Live
No strategy should touch real money until you've tested it thoroughly. Backtesting means applying your rules to historical price data to see how it would have performed. Go back 6-12 months and manually mark every trade signal, recording wins, losses, and risk-reward outcomes.
After backtesting shows promise (at least 100 trades with positive expectancy), move to forward testing on a demo account for 1-2 months. This reveals how the strategy performs in real-time market conditions with actual execution delays and emotional pressures. Only after consistent demo results should you risk small amounts of real capital.
Track every trade in a journal: entry/exit price, reason for trade, profit/loss, and what you learned. This data reveals patterns in your performance and shows whether your strategy has a genuine edge or just got lucky during testing.
Conclusion: Simplicity and Consistency Win
Building a Forex strategy that works isn't about finding complex formulas or secret indicators. Focus on a clear timeframe, 2-3 complementary tools, objective rules, and disciplined risk management. Test thoroughly before trading live, and remember that consistent execution of a simple plan beats constantly switching between complicated systems. Start small, track your results, and refine your approach based on real performance data, not emotions or hunches.