The Most Reliable Technical Indicators for New Traders
New traders often struggle with the overwhelming number of technical indicators available on modern trading platforms. While some indicators promise miraculous results, most are redundant variations of the same mathematical formulas. This guide breaks down the five most reliable and time-tested indicators that actually help beginners make informed trading decisions without cluttering their charts with noise.
Moving Averages: The Foundation of Trend Analysis
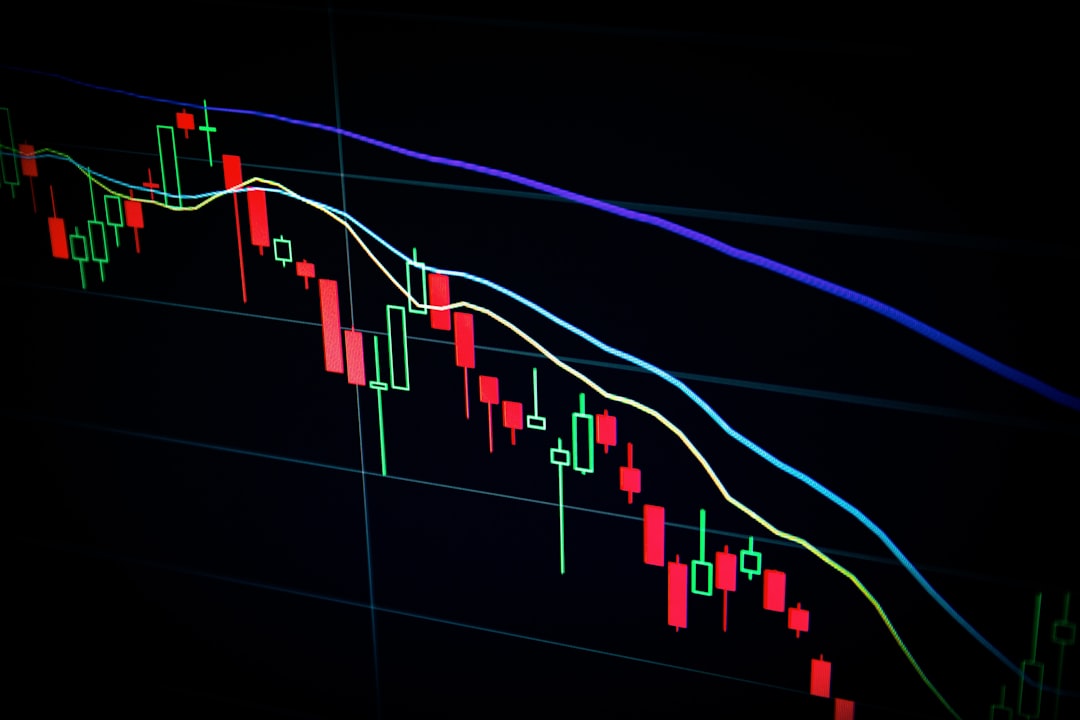
Moving averages (MA) are the most fundamental indicator for identifying trends and support/resistance levels. They smooth out price action by calculating the average closing price over a specific period. The two most popular types are the Simple Moving Average (SMA) and Exponential Moving Average (EMA).
For beginners, start with these combinations:
- 50-day and 200-day SMA for identifying long-term trends
- 20-day EMA for short-term trend confirmation
- Golden Cross (50-day crossing above 200-day) signals bullish momentum
- Death Cross (50-day crossing below 200-day) warns of bearish trends
The key advantage is simplicity—moving averages don't predict the future but clearly show what the market is currently doing. They work best in trending markets and provide dynamic support/resistance levels that price often respects.
Relative Strength Index (RSI): Spotting Overbought and Oversold Conditions
The Relative Strength Index (RSI) is a momentum oscillator that measures the speed and magnitude of price movements on a scale from 0 to 100. Developed by J. Welles Wilder, it helps identify potential reversal points when markets become overextended.
| RSI Level | Market Condition | Trading Implication |
|---|---|---|
| Above 70 | Overbought | Potential sell signal or profit-taking zone |
| Below 30 | Oversold | Potential buy signal or bounce area |
| 50-70 | Bullish Momentum | Trend continuation likely |
| 30-50 | Bearish Momentum | Downtrend may persist |
Important note: In strong trends, RSI can remain overbought or oversold for extended periods. Never use RSI alone—combine it with trend indicators like moving averages for confirmation. The 14-period RSI is the standard setting for most trading timeframes.
MACD: The Trend and Momentum Combo
The Moving Average Convergence Divergence (MACD) combines trend-following and momentum characteristics, making it exceptionally versatile. It consists of three components: the MACD line (12-day EMA minus 26-day EMA), signal line (9-day EMA of MACD), and histogram (difference between MACD and signal lines).
Key signals to watch:
- MACD crosses above signal line = bullish signal
- MACD crosses below signal line = bearish signal
- Histogram expansion = strengthening momentum
- Divergence = price makes new highs/lows but MACD doesn't, signaling potential reversal
MACD excels in trending markets but produces false signals during consolidation phases. Wait for clear crossovers and confirm with price action before entering trades.
Support and Resistance Levels: Price Memory Zones
Support and resistance aren't calculated indicators but psychological price levels where buying and selling pressure concentrates. Support is where price tends to stop falling; resistance is where price struggles to break higher. These levels form the backbone of technical analysis.
Identify these levels by:
- Marking previous swing highs and lows on your chart
- Noting round numbers (psychological levels like 1.2000 in EUR/USD)
- Observing where price has reversed multiple times
- Using horizontal lines at these key zones
When combined with indicators like RSI or MACD, support and resistance levels provide high-probability trade setups. For example, buying at support when RSI is oversold offers better risk/reward than random entries.
Volume: The Truth Behind Price Movements
Volume measures how many units are traded during a specific period and confirms the strength behind price movements. High volume validates trends and breakouts, while low volume suggests weak momentum or potential reversals.
Volume analysis rules:
- Rising prices with increasing volume = strong uptrend
- Rising prices with decreasing volume = weakening trend, possible reversal
- Breakouts with high volume = more likely to sustain
- Breakouts with low volume = often false breakouts
In Forex trading, tick volume (number of price changes) is used instead of actual volume since Forex is decentralized. While not perfect, it still provides valuable confirmation signals when combined with other indicators.
Mastering these five reliable indicators gives new traders a solid foundation without overwhelming their decision-making process. Remember that no indicator works perfectly in all market conditions—the key is using them together to confirm signals and filtering out low-probability trades. Start with moving averages and support/resistance, then gradually add RSI, MACD, and volume analysis as you gain experience. Focus on understanding why these indicators work rather than blindly following signals, and always practice proper risk management regardless of how confident your technical setup appears.