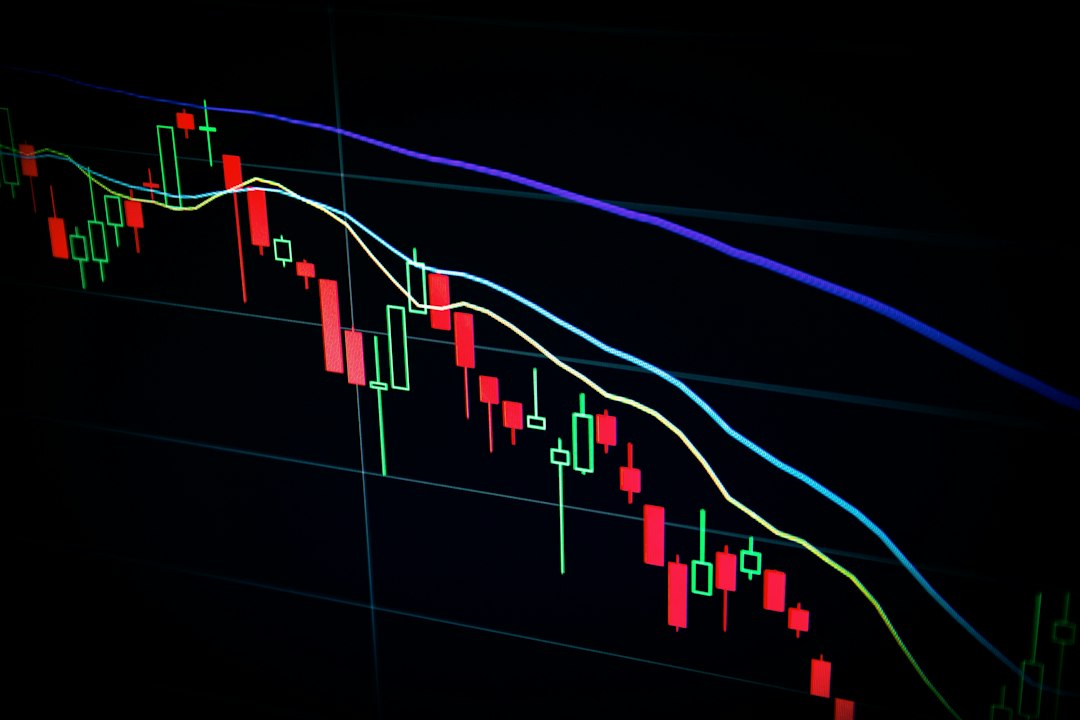
How to Identify Fake Breakouts in Forex Trading
Fake breakouts, also known as false breakouts or fakeouts, are one of the most frustrating traps for Forex traders. These occur when price briefly moves beyond a key support or resistance level, triggering entries, only to reverse sharply and move in the opposite direction. Understanding how to identify these deceptive moves can save you from costly losses and improve your trading success rate. In this guide, you'll learn practical techniques to distinguish genuine breakouts from false ones using volume analysis, confirmation strategies, and market context.
Understanding the Anatomy of Fake Breakouts
False breakouts happen when market participants—often institutional traders—push price beyond key levels to trigger stop losses and activate pending orders from retail traders. Once these orders are executed, the institutions reverse their positions, causing price to snap back. Recognizing the mechanics behind fake breakouts helps you avoid being trapped on the wrong side of the market.
Common characteristics of fake breakouts include: minimal candle body beyond the level, immediate reversal within 1-3 candles, low trading volume during the breakout, and lack of follow-through momentum. Genuine breakouts typically show strong momentum, increased volume, and sustained movement in the breakout direction. The key is learning to wait for confirmation rather than jumping into trades immediately when a level breaks.
Volume and Momentum Confirmation Techniques
Volume analysis is your first line of defense against fake breakouts. Genuine breakouts are accompanied by significantly increased trading volume, indicating strong participation and conviction from market participants. When you see a breakout on low volume, it's a red flag that the move lacks institutional support and may reverse quickly.
To confirm breakout validity, look for these momentum indicators:
- Volume spike: At least 50-100% higher than average during the breakout candle
- Large-bodied candles: Strong directional candles with small wicks showing commitment
- Follow-through: Price continues moving in breakout direction for at least 3-5 candles
- No immediate retest: Price doesn't immediately return to test the broken level within 1-2 candles
Using multiple timeframe analysis also helps—check if the breakout on your trading timeframe aligns with the trend on higher timeframes. A breakout against the higher timeframe trend has a much higher probability of being false.
Comparison of Real vs. Fake Breakout Characteristics
Understanding the differences between authentic and false breakouts requires examining specific technical features. The following table summarizes key distinguishing factors that help traders make better entry decisions:
| Characteristic | Real Breakout | Fake Breakout |
|---|---|---|
| Volume | High, 50-150% above average | Low or average volume |
| Candle Body | Large body, small wicks | Small body, large wicks |
| Follow-Through | Sustained for 5+ candles | Reverses within 1-3 candles |
| Retest Behavior | Retest holds as new support/resistance | Breaks back through immediately |
| Market Context | Aligns with higher timeframe trend | Against higher timeframe trend |
Practical Strategies to Avoid False Breakout Traps
Wait for the close is the golden rule for breakout trading. Never enter a trade based on a wick or intracandle movement beyond a key level. Wait for the candle to close beyond the level with at least 50% of the candle body outside the range. Even better, wait for a retest of the broken level—genuine breakouts often pull back to the broken support (now resistance) or resistance (now support) before continuing.
Implement these risk management tactics:
- Use smaller position sizes on breakout trades until confirmation appears
- Place stops beyond the recent swing high/low, not just at the breakout level
- Set a time stop—if the breakout doesn't gain momentum within 5-10 candles, exit
- Avoid trading breakouts during low-volume periods like Asian session or major holidays
Consider using pending orders above/below breakout levels with wider stops rather than market orders. This prevents emotional entries while ensuring you only get filled if price commits to the direction.
Using Market Context and News Events
The broader market environment significantly impacts breakout authenticity. Fake breakouts often occur in ranging or consolidating markets where price lacks directional conviction. Before trading any breakout, assess whether the market is trending or ranging on higher timeframes. Breakouts from consolidation within strong trends have higher success rates than breakouts in choppy, directionless markets.
Be especially cautious around major economic news releases. Price can spike in both directions within minutes, triggering stops and creating false breakouts before settling into the true directional move. Many experienced traders avoid breakout setups during high-impact news events like NFP, FOMC, or central bank decisions. Instead, wait 30-60 minutes after major announcements for volatility to settle before considering breakout trades.
In conclusion, identifying fake breakouts requires patience, proper confirmation, and understanding of market mechanics. By waiting for volume confirmation, analyzing candle structure, using multiple timeframes, and respecting market context, you can significantly reduce your exposure to false breakouts. Remember that not every breakout deserves your capital—the best trades often require waiting for clear confirmation rather than chasing every level break. Implement these techniques consistently, and you'll develop an eye for spotting genuine opportunities while avoiding costly traps.